Argentina / Buenos Aires
Salina del Algarrobo
Salina del Algarrobo is a beach, 39.1 km north of Carmen de Patagones (Buenos Aires, Argentina). The sea averages 22.0 °C in January, its warmest month, and 8.5 °C in July; it is 21 °C or warmer in January–February.
Average sea surface temperature by month. Current month outlined.
Month by month
November at Salina del Algarrobo
Beach-day index 6.6/10 · Argentina median 4.1
| Measure | Jan | Feb | Mar | Apr | May | Jun | Jul | Aug | Sep | Oct | Nov | Dec |
|---|---|---|---|---|---|---|---|---|---|---|---|---|
| Sea °C | 22.0 °C | 21.7 °C | 20.0 °C | 16.8 °C | 13.6 °C | 10.5 °C | 8.5 °C | 8.5 °C | 10.3 °C | 13.3 °C | 16.8 °C | 19.9 °C |
| High °C | 29° | 28° | 25° | 20° | 15° | 12° | 11° | 13° | 16° | 20° | 24° | 27° |
| Low °C | 17° | 17° | 14° | 10° | 7° | 4° | 3° | 4° | 6° | 9° | 12° | 15° |
| Rain mm | 39 | 54 | 57 | 41 | 35 | 24 | 35 | 27 | 32 | 52 | 39 | 33 |
| Cloud % | 37 | 39 | 41 | 48 | 58 | 58 | 58 | 59 | 54 | 55 | 48 | 43 |
| Wind m/s | 6.0 | 5.8 | 5.6 | 5.4 | 5.2 | 5.6 | 5.4 | 5.4 | 5.2 | 5.3 | 5.6 | 5.9 |
| Daylight h | 14.8 | 13.7 | 12.4 | 11.1 | 9.9 | 9.3 | 9.5 | 10.5 | 11.8 | 13.1 | 14.3 | 15.0 |
| Record high/low | 38°/10° | 38°/10° | 35°/8° | 31°/2° | 27°/1° | 18°/-3° | 19°/-4° | 24°/-2° | 25°/-1° | 32°/3° | 34°/4° | 39°/7° |
| Beach index | 8.7 | 8.5 | 7.8 | 4.8 | 2.9 | 3.0 | 2.9 | 3.0 | 3.0 | 4.0 | 6.6 | 8.0 |
Long-term monthly averages: air from NASA POWER (2001–2020), sea from NOAA OISST (1991–2020); records are the extremes of 2001–2020. How the index works.
When to go
The beach-day index peaks in January–February; January scores 8.7/10 with highs of 29 °C, sea at 22.0 °C and 39 mm of rain.
In January that is 1.9 points above the median of the 71 beaches in Argentina covered by this atlas.
At its warmest the water here is 5.3 °C warmer than the Argentina median for January (16.7 °C).
Across the year the sea averages 15.2 °C, cooler than 74% of the coastal beaches in the atlas.
March is the wettest month (57 mm) and June the driest (24 mm); the yearly total is about 470 mm.
Daylight runs from 9.3 hours in June to 15.0 hours in December; in mid-January the sun rises at 05:57 and sets at 20:43 local time.
Setting
Within 1 km, the land is 85% bare ground, sand or rock and 15% grassland (satellite land-cover map, 2021): open dunes, sand or rock. Water makes up 60% of that circle.
- Bare 85%
- Grass 15%
Land cover: ESA WorldCover 2021 (10 m).
Getting there
| Airport | Code | Distance | Direction |
|---|---|---|---|
| Gobernador Castello Airport Viedma / Carmen de Patagones | VDM | 46.5 km | south |
| Comandante Espora Airport Bahía Blanca | BHI | 204 km | north |
| El Tehuelche Airport Puerto Madryn | PMY | 313 km | south-west |
Straight-line distances from the beach; road distance is usually 20–40% longer.
Map and nearby beaches
Loading map…
Open in OpenStreetMap · Directions in Google Maps
| Beach | Distance | Warmest sea | Length | Surface |
|---|---|---|---|---|
| Salina del Algarrobo | – | 22.0 °C | – | – |
| La Salinita | 22.2 km E | 22.0 °C | – | – |
| Salina de Piedras | 24.9 km SE | 22.0 °C | – | – |
| Salina de Piedra | 31.9 km SE | 20.4 °C | – | – |
| Salina de la Espuma | 35.8 km SW | 19.1 °C | – | – |
| Salitral del Barrancoso | 40.4 km SE | 22.0 °C | – | – |
| Salitral Grande | 52.4 km SE | 20.4 °C | – | – |
- La Salinita22.2 km ECompare
- Salina de Piedras24.9 km SECompare
- Salina de Piedra31.9 km SECompare
- Salina de la Espuma35.8 km SWCompare
- Salitral del Barrancoso40.4 km SECompare
- Salitral Grande52.4 km SECompare
- La Salinita54.1 km SECompare
Data on this page
- Air temperature, rain, cloud, wind, humidity: NASA POWER climatology 2001–2020, 0.5° grid.
- Sea temperature: NOAA OISST v2.1 monthly normals 1991–2020, nearest ocean cell 50.0 km away.
- Water body, status and length: Wikidata (CC0).
- Towns and time zone: GeoNames (CC BY 4.0). Airports: OurAirports (public domain). Sunrise and sunset: NOAA solar equations.
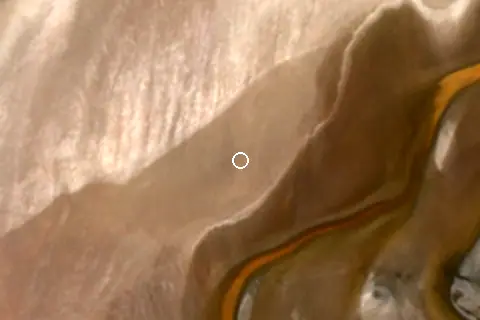
- Satellite view: Copernicus Sentinel-2 (ESA), scene S2C_20GMA_20260311_0_L2A.
- Settlements: GeoNames places with 1,000+ inhabitants.
- Land cover: ESA WorldCover 2021, 10 m (CC BY 4.0).
Data compiled 2026-10-13. Something wrong? Report a data error.