Australia / Western Australia
Middini Beach
Middini Beach is a 694 m-long beach facing south-south-east, 545 km east of Castletown (Western Australia, Australia). The sea averages 21.4 °C in February, its warmest month, and 15.2 °C in August; it is 21 °C or warmer in February–March.
Average sea surface temperature by month. Current month outlined.
Month by month
November at Middini Beach
Beach-day index 7.3/10 · Australia median 5.7
| Measure | Jan | Feb | Mar | Apr | May | Jun | Jul | Aug | Sep | Oct | Nov | Dec |
|---|---|---|---|---|---|---|---|---|---|---|---|---|
| Sea °C | 20.8 °C | 21.4 °C | 21.1 °C | 20.3 °C | 18.9 °C | 17.1 °C | 15.7 °C | 15.2 °C | 15.4 °C | 16.5 °C | 17.8 °C | 19.3 °C |
| High °C | 28° | 27° | 26° | 24° | 21° | 18° | 18° | 19° | 21° | 24° | 26° | 27° |
| Low °C | 17° | 17° | 16° | 15° | 12° | 10° | 9° | 9° | 10° | 12° | 14° | 15° |
| Rain mm | 25 | 35 | 24 | 23 | 26 | 29 | 27 | 26 | 20 | 17 | 24 | 31 |
| Cloud % | 53 | 60 | 55 | 53 | 54 | 51 | 48 | 45 | 41 | 47 | 52 | 53 |
| Wind m/s | 6.4 | 6.3 | 5.8 | 5.1 | 5.0 | 5.2 | 5.3 | 5.5 | 5.9 | 6.1 | 6.2 | 6.3 |
| Daylight h | 14.0 | 13.3 | 12.3 | 11.3 | 10.5 | 10.1 | 10.2 | 10.9 | 11.9 | 12.8 | 13.8 | 14.2 |
| Record high/low | 45°/13° | 44°/14° | 42°/12° | 38°/10° | 33°/7° | 28°/4° | 27°/4° | 30°/5° | 35°/5° | 38°/8° | 42°/9° | 44°/12° |
| Beach index | 8.2 | 8.2 | 8.4 | 7.9 | 6.0 | 4.2 | 3.5 | 4.0 | 5.1 | 6.4 | 7.3 | 7.7 |
Long-term monthly averages: air from NASA POWER (2001–2020), sea from NOAA OISST (1991–2020); records are the extremes of 2001–2020. How the index works.
When to go
The beach-day index peaks in January–April; March scores 8.4/10 with highs of 26 °C, sea at 21.1 °C and 24 mm of rain.
In March that is 1.1 points above the median of the 1,950 beaches in Australia covered by this atlas.
At its warmest the water here is 0.8 °C cooler than the Australia median for February (22.2 °C).
Across the year the sea averages 18.3 °C, cooler than 55% of the coastal beaches in the atlas.
February is the wettest month (35 mm) and October the driest (17 mm); the yearly total is about 310 mm.
Daylight runs from 10.1 hours in June to 14.2 hours in December; in mid-March the sun rises at 05:29 and sets at 17:49 local time.
Orientation, sun and shore
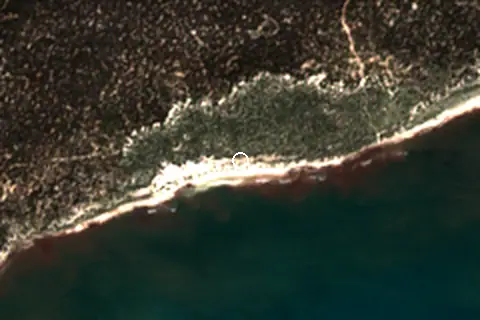
The shore faces south-south-east (165°). Open water fills about 44% of the horizon close by, which makes it an open stretch of shore.
The sun sets over the sea in December–January; in mid-December it goes down at 18:32 local time on a bearing of 242°.
Sunrise is over the sea in September–March.
Straight out to the south-south-east there is open water for more than 2,000 km, so the beach is exposed to long ocean swell.
About 1 km offshore the sea is roughly 6 m deep and 6 m at 3 km, a shallow, gently shelving sea floor. Behind the beach the ground is about 16 m above sea level 500 m inland and 18 m at 1.5 km.
Within 1 km, the land is 73% tree cover, 11% shrubland and 11% grassland (satellite land-cover map, 2021): a largely natural setting. Water makes up 43% of that circle.
- Tree 73%
- Shrub 11%
- Grass 11%
- Bare 4%
Land cover: ESA WorldCover 2021 (10 m). Orientation from OpenStreetMap land polygons sampled in 36 directions; depths and heights from the GEBCO 2020 grid (about 450 m cells), indicative only.
Map
Loading map…
Data on this page
- Air temperature, rain, cloud, wind, humidity: NASA POWER climatology 2001–2020, 0.5° grid.
- Sea temperature: NOAA OISST v2.1 monthly normals 1991–2020, nearest ocean cell 17.4 km away.
- Beach outline, surface, rules and public facilities: OpenStreetMap contributors (ODbL), feature w1417171133; restaurants, cafés, bars and lodging: Overture Maps places (CDLA-Permissive-2.0).
- Water body, status and length: Wikidata (CC0).
- Towns and time zone: GeoNames (CC BY 4.0). Airports: OurAirports (public domain). Sunrise and sunset: NOAA solar equations.
- Satellite view: Copernicus Sentinel-2 (ESA), scene S2B_52HCK_20240907_0_L2A.
- Orientation: OpenStreetMap land polygons (ODbL). Depth and terrain: GEBCO 2020 grid.
- Settlements: GeoNames places with 1,000+ inhabitants.
- Land cover: ESA WorldCover 2021, 10 m (CC BY 4.0).
Data compiled 2026-10-13. Something wrong? Report a data error.