Australia / Australian Capital Territory
Sylvia Curley Bridge
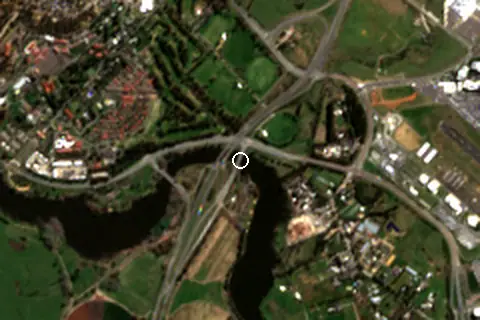
Sylvia Curley Bridge is an inland beach, 2.4 km south-east of Campbell (Australian Capital Territory, Australia). Average daytime highs peak at 30 °C in January and drop to 10 °C in July.
Weather month by month
November at Sylvia Curley Bridge
Beach-day index 8.1/10 · Australia median 5.7
| Measure | Jan | Feb | Mar | Apr | May | Jun | Jul | Aug | Sep | Oct | Nov | Dec |
|---|---|---|---|---|---|---|---|---|---|---|---|---|
| High °C | 30° | 27° | 24° | 20° | 15° | 11° | 10° | 12° | 16° | 20° | 24° | 27° |
| Low °C | 14° | 13° | 11° | 8° | 4° | 2° | 1° | 1° | 4° | 6° | 10° | 12° |
| Rain mm | 54 | 86 | 62 | 35 | 29 | 64 | 43 | 51 | 45 | 52 | 69 | 67 |
| Cloud % | 57 | 60 | 56 | 51 | 44 | 51 | 44 | 44 | 46 | 54 | 59 | 58 |
| Wind m/s | 4.3 | 4.1 | 3.9 | 3.5 | 3.7 | 4.0 | 4.3 | 4.6 | 4.5 | 4.3 | 4.3 | 4.3 |
| Daylight h | 14.3 | 13.4 | 12.4 | 11.2 | 10.3 | 9.8 | 10.0 | 10.8 | 11.8 | 12.9 | 14.0 | 14.5 |
| Record high/low | 42°/5° | 41°/6° | 35°/3° | 32°/-1° | 24°/-2° | 20°/-4° | 17°/-4° | 20°/-4° | 30°/-3° | 31°/-2° | 39°/1° | 40°/3° |
| Beach index | 8.6 | 8.3 | 8.0 | 5.8 | 4.4 | 3.9 | 4.2 | 4.0 | 4.1 | 5.8 | 8.1 | 8.5 |
Long-term monthly averages: air from NASA POWER (2001–2020), sea from NOAA OISST (1991–2020); records are the extremes of 2001–2020. How the index works.
Setting
Within 1 km, the land is 49% grassland, 26% tree cover and 22% built-up land (satellite land-cover map, 2021): a partly built-up setting. Water makes up 8% of that circle.
- Grass 49%
- Tree 26%
- Built 22%
- Crop 3%
Land cover: ESA WorldCover 2021 (10 m).
This is not a sea beach, so no sea-temperature normals are shown.
When to go
The beach-day index peaks in November–March; January scores 8.6/10 with highs of 30 °C and 54 mm of rain.
In January that is 1.2 points above the median of the 1,950 beaches in Australia covered by this atlas.
February is the wettest month (86 mm) and May the driest (29 mm); the yearly total is about 660 mm.
Daylight runs from 9.8 hours in June to 14.5 hours in December; in mid-January the sun rises at 06:03 and sets at 20:20 local time.
Facilities within 1 km
- 2Restaurants, cafés & bars
- 3Public toilets
- –Showers
- 1Drinking water
- 59Car parks
- –Lifeguard stations
- 1Grocery shops
- 16Bus stops (1.5 km)
- 1Pharmacies & clinics
Food and drink mapped within 1 km: 1 restaurant and 1 café.
Counted within 1 km of the beach (bus stops 1.5 km) from OpenStreetMap features and Overture Maps places, release of 2026-10. Unmapped does not mean absent.
Getting there
| Airport | Code | Distance | Direction |
|---|---|---|---|
| Canberra Airport Canberra | CBR | 2.0 km | east |
| Moruya Airport Moruya | MYA | 110 km | south-east |
| Cooma Snowy Mountains Airport Cooma | OOM | 112 km | south |
Straight-line distances from the beach; road distance is usually 20–40% longer.
Local transport: 16 bus stops within 1.5 km and 59 mapped car parks within 1 km.
36 towns and villages of 1,000+ people lie within 10 km (about 516.7K residents); within 30 km there are 109 (about 898.1K).
Map and nearby beaches
Loading map…
Open in OpenStreetMap · Directions in Google Maps
| Beach | Distance | Warmest sea | Length | Surface |
|---|---|---|---|---|
| Sylvia Curley Bridge | – | – | – | – |
| Bimbi Beach | 12.1 km NW | – | – | – |
| Gummiuk Beach | 12.4 km NW | – | – | – |
| Nengi Bamir Beach | 12.8 km NW | – | – | – |
| Dulwa Beach | 12.9 km NW | – | 72 m | – |
| Bargang Beach | 13.0 km NW | – | – | – |
| Yerra Beach | 13.2 km NW | – | – | – |
- Bimbi Beach12.1 km NWCompare
- Gummiuk Beach12.4 km NWCompare
- Nengi Bamir Beach12.8 km NWCompare
- Dulwa Beach12.9 km NWCompare
- Bargang Beach13.0 km NWCompare
- Yerra Beach13.2 km NWCompare
- Mundang Beach14.8 km SWCompare
- Ngadyung Beach15.0 km SWCompare
Data on this page
- Air temperature, rain, cloud, wind, humidity: NASA POWER climatology 2001–2020, 0.5° grid.
- Beach outline, surface, rules and public facilities: OpenStreetMap contributors (ODbL), feature w996563857; restaurants, cafés, bars and lodging: Overture Maps places (CDLA-Permissive-2.0).
- Water body, status and length: Wikidata (CC0).
- Towns and time zone: GeoNames (CC BY 4.0). Airports: OurAirports (public domain). Sunrise and sunset: NOAA solar equations.
- Satellite view: Copernicus Sentinel-2 (ESA), scene S2B_55HFB_20260910_0_L2A.
- Settlements: GeoNames places with 1,000+ inhabitants.
- Land cover: ESA WorldCover 2021, 10 m (CC BY 4.0).
Data compiled 2026-10-13. Something wrong? Report a data error.