Canada / Manitoba
Chiefs Point Beach
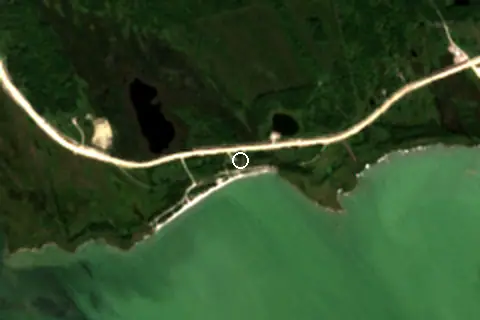
Chiefs Point Beach is an inland beach facing south-south-west, 91.5 km west of Arborg (Manitoba, Canada). Average daytime highs peak at 26 °C in July and drop to -13 °C in January.
Weather month by month
November at Chiefs Point Beach
Beach-day index 3.9/10 · Canada median 2.2
| Measure | Jan | Feb | Mar | Apr | May | Jun | Jul | Aug | Sep | Oct | Nov | Dec |
|---|---|---|---|---|---|---|---|---|---|---|---|---|
| High °C | -13° | -11° | -2° | 9° | 17° | 23° | 26° | 25° | 19° | 8° | -2° | -11° |
| Low °C | -22° | -21° | -11° | -1° | 6° | 13° | 16° | 15° | 8° | 0° | -9° | -19° |
| Rain mm | 21 | 17 | 31 | 34 | 70 | 88 | 72 | 65 | 52 | 49 | 26 | 21 |
| Cloud % | 65 | 62 | 67 | 65 | 64 | 64 | 55 | 56 | 59 | 68 | 72 | 72 |
| Wind m/s | 4.7 | 4.6 | 5.0 | 5.2 | 5.2 | 4.6 | 4.4 | 4.4 | 4.8 | 5.0 | 4.7 | 4.4 |
| Daylight h | 8.4 | 10.0 | 11.8 | 13.8 | 15.5 | 16.5 | 16.1 | 14.6 | 12.7 | 10.8 | 9.0 | 8.0 |
| Record high/low | 3°/-45° | 3°/-41° | 23°/-39° | 25°/-20° | 30°/-6° | 35°/2° | 35°/8° | 36°/6° | 31°/-3° | 27°/-13° | 13°/-30° | 3°/-41° |
| Beach index | 4.1 | 4.2 | 3.9 | 3.8 | 3.5 | 6.6 | 8.4 | 8.4 | 4.7 | 3.7 | 3.9 | 4.1 |
Long-term monthly averages: air from NASA POWER (2001–2020), sea from NOAA OISST (1991–2020); records are the extremes of 2001–2020. How the index works.
Orientation, sun and shore
The shore faces south-south-west (205°). Open lake water fills about 67% of the horizon close by, which makes it an exposed spot with water on most sides.
The beach lies on Manitoba, which covers about 4,831 km².
The sun sets over the lake in every month; in mid-June it goes down at 21:48 local time on a bearing of 310°.
Sunrise is over the lake in October–March.
Straight across the lake to the south-south-west, open water reaches about 20.0 km before the far shore.
Within 1 km, the land is 55% grassland, 31% tree cover and 9% cropland (satellite land-cover map, 2021): a largely natural setting. Water makes up 38% of that circle.
- Grass 55%
- Tree 31%
- Crop 9%
Land cover: ESA WorldCover 2021 (10 m). Orientation and lake size from Natural Earth lake polygons sampled in 36 directions.
This is not a sea beach, so no sea-temperature normals are shown.
When to go
The beach-day index peaks in July–August; July scores 8.4/10 with highs of 26 °C and 72 mm of rain.
In July that is 3.6 points above the median of the 1,211 beaches in Canada covered by this atlas.
June is the wettest month (88 mm) and February the driest (17 mm); the yearly total is about 550 mm.
Daylight runs from 8.0 hours in December to 16.5 hours in June; in mid-July the sun rises at 05:36 and sets at 21:43 local time.
Getting there
| Airport | Code | Distance | Direction |
|---|---|---|---|
| Dauphin Barker Airport Dauphin | YDN | 110 km | west |
| Winnipeg / James Armstrong Richardson International Airport Winnipeg | YWG | 141 km | south-east |
| Brandon Municipal Airport Brandon | YBR | 148 km | south-west |
Straight-line distances from the beach; road distance is usually 20–40% longer.
Map and nearby beaches
Loading map…
Open in OpenStreetMap · Directions in Google Maps
| Beach | Distance | Warmest sea | Length | Surface |
|---|---|---|---|---|
| Chiefs Point Beach | – | – | – | – |
| Long Point Beach | 18.7 km SE | – | – | – |
| Sigfussons Beach | 27.2 km SE | – | – | – |
| Silver Bay Beach | 37.0 km N | – | – | – |
- Long Point Beach18.7 km SECompare
- Sigfussons Beach27.2 km SECompare
- Silver Bay Beach37.0 km NCompare
Data on this page
- Air temperature, rain, cloud, wind, humidity: NASA POWER climatology 2001–2020, 0.5° grid.
- Water body, status and length: Wikidata (CC0).
- Towns and time zone: GeoNames (CC BY 4.0). Airports: OurAirports (public domain). Sunrise and sunset: NOAA solar equations.
- Satellite view: Copernicus Sentinel-2 (ESA), scene S2A_14UNB_20240909_0_L2A.
- Orientation: OpenStreetMap land polygons (ODbL). Depth and terrain: GEBCO 2020 grid.
- Settlements: GeoNames places with 1,000+ inhabitants.
- Land cover: ESA WorldCover 2021, 10 m (CC BY 4.0).
Data compiled 2026-10-13. Something wrong? Report a data error.