Chile / Tarapacá
Salar de Pintados
Salar de Pintados is a beach, 32.8 km south of Pozo Almonte (Tarapacá, Chile). The sea averages 21.5 °C in February, its warmest month, and 16.8 °C in August; it is 21 °C or warmer in January–February.
Average sea surface temperature by month. Current month outlined.

Month by month
November at Salar de Pintados
Beach-day index 8.2/10 · Chile median 5.9
| Measure | Jan | Feb | Mar | Apr | May | Jun | Jul | Aug | Sep | Oct | Nov | Dec |
|---|---|---|---|---|---|---|---|---|---|---|---|---|
| Sea °C | 21.4 °C | 21.5 °C | 20.7 °C | 19.7 °C | 19.1 °C | 17.9 °C | 17.1 °C | 16.8 °C | 17.0 °C | 17.8 °C | 19.1 °C | 20.3 °C |
| High °C | 24° | 24° | 24° | 24° | 23° | 22° | 22° | 23° | 24° | 24° | 24° | 24° |
| Low °C | 12° | 12° | 12° | 11° | 9° | 8° | 8° | 8° | 9° | 10° | 10° | 11° |
| Rain mm | 5 | 5 | 3 | 1 | 0 | 1 | 0 | 1 | 1 | 0 | 1 | 2 |
| Cloud % | 40 | 41 | 27 | 24 | 24 | 28 | 27 | 23 | 20 | 21 | 22 | 28 |
| Wind m/s | 3.5 | 3.4 | 3.2 | 3.1 | 3.0 | 2.9 | 3.0 | 3.2 | 3.2 | 3.3 | 3.5 | 3.5 |
| Daylight h | 13.3 | 12.8 | 12.2 | 11.6 | 11.2 | 10.9 | 11.0 | 11.4 | 12.0 | 12.5 | 13.1 | 13.4 |
| Record high/low | 30°/9° | 29°/9° | 30°/9° | 29°/7° | 30°/5° | 29°/4° | 30°/2° | 30°/2° | 29°/5° | 30°/4° | 29°/7° | 30°/7° |
| Beach index | 8.8 | 8.7 | 8.7 | 8.2 | 7.6 | 6.8 | 6.4 | 6.9 | 7.3 | 7.8 | 8.2 | 8.5 |
Long-term monthly averages: air from NASA POWER (2001–2020), sea from NOAA OISST (1991–2020); records are the extremes of 2001–2020. How the index works.
When to go
The beach-day index peaks in December–March; January scores 8.8/10 with highs of 24 °C, sea at 21.4 °C and 5 mm of rain.
In January that is 1.8 points above the median of the 204 beaches in Chile covered by this atlas.
At its warmest the water here is 5.3 °C warmer than the Chile median for February (16.2 °C).
Across the year the sea averages 19.0 °C, warmer than 53% of the coastal beaches in the atlas.
January is the wettest month (5 mm) and May the driest (0 mm); the yearly total is about 20 mm.
Daylight runs from 10.9 hours in June to 13.4 hours in December; in mid-January the sun rises at 07:10 and sets at 20:24 local time.
Setting
Within 1 km, the land is 100% bare ground, sand or rock (satellite land-cover map, 2021): open dunes, sand or rock.
- Bare 100%
Land cover: ESA WorldCover 2021 (10 m).
Photos


From above
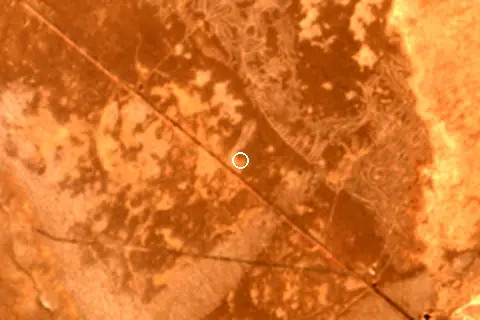
Nearest services
| Service | Nearest mapped | Distance | Direction |
|---|---|---|---|
| Accommodation | El Huarango | 19.2 km | north-east |
| Car park | — | 11.1 km | south-east |
| Public toilets | — | 12.4 km | north |
| Bus stop | — | 16.0 km | south-east |
Straight-line distance to the nearest feature within 20 km, from OpenStreetMap and Overture Maps places. A category is missing when nothing is mapped within 20 km.
Getting there
| Airport | Code | Distance | Direction |
|---|---|---|---|
| Diego Aracena International Airport Iquique | IQQ | 46.8 km | west |
| El Loa Airport Calama | CJC | 233 km | south |
| Chacalluta International Airport Arica | ARI | 253 km | north |
Straight-line distances from the beach; road distance is usually 20–40% longer.
Reference
Salar de Pintados has an article on the ES Wikipedia: Salar de Pintados.
Wikidata item Q22388976.
When people look it up
The ES Wikipedia article was read 326 times in the 12 months to August 2026. Interest peaks in January (46 views), 2.9× the quietest month.
Map and nearby beaches
Loading map…
Open in OpenStreetMap · Directions in Google Maps
| Beach | Distance | Warmest sea | Length | Surface |
|---|---|---|---|---|
| Salar de Pintados | – | 21.5 °C | – | – |
| Salar de Bella Vista | 23.1 km SE | 21.2 °C | – | – |
| Salar del Soronal | 27.3 km W | 21.5 °C | – | – |
| Playa Ñajo | 48.3 km W | 22.0 °C | – | – |
| Salar Grande (coast) | 48.8 km SW | 21.2 °C | – | – |
| Playa Yape | 49.8 km W | 22.0 °C | – | – |
| Salar Grande | 51.0 km SW | 21.2 °C | – | – |
- Salar de Bella Vista23.1 km SECompare
- Salar del Soronal27.3 km WCompare
- Playa Ñajo48.3 km WCompare
- Salar Grande (coast)48.8 km SWCompare
- Playa Yape49.8 km WCompare
- Salar Grande51.0 km SWCompare
- Playa Larga52.4 km NWCompare
Data on this page
- Air temperature, rain, cloud, wind, humidity: NASA POWER climatology 2001–2020, 0.5° grid.
- Sea temperature: NOAA OISST v2.1 monthly normals 1991–2020, nearest ocean cell 45.2 km away.
- Water body, status and length: Wikidata (CC0).
- Towns and time zone: GeoNames (CC BY 4.0). Airports: OurAirports (public domain). Sunrise and sunset: NOAA solar equations.
- Photos: Wikimedia Commons, author and licence under each image.
- Satellite view: Copernicus Sentinel-2 (ESA), scene S2C_19KDT_20260922_0_L2A.
- Settlements: GeoNames places with 1,000+ inhabitants.
- Nearest services: OpenStreetMap and Overture Maps places within 20 km.
- Land cover: ESA WorldCover 2021, 10 m (CC BY 4.0).
Data compiled 2026-10-13. Something wrong? Report a data error.