Salar de Quisquiro
Salar de Quisquiro is an inland beach, 95.0 km west of Susques (Chile). Average daytime highs peak at 17 °C in December and drop to 6 °C in July.
Weather month by month
November at Salar de Quisquiro
Beach-day index 4.6/10 · Chile median 5.9
| Measure | Jan | Feb | Mar | Apr | May | Jun | Jul | Aug | Sep | Oct | Nov | Dec |
|---|---|---|---|---|---|---|---|---|---|---|---|---|
| High °C | 16° | 15° | 15° | 12° | 7° | 6° | 6° | 7° | 10° | 13° | 16° | 17° |
| Low °C | -2° | -2° | -3° | -6° | -8° | -8° | -9° | -8° | -7° | -6° | -5° | -3° |
| Rain mm | 65 | 57 | 40 | 13 | 3 | 1 | 2 | 1 | 2 | 12 | 19 | 50 |
| Cloud % | 40 | 38 | 24 | 25 | 31 | 37 | 36 | 35 | 28 | 24 | 21 | 26 |
| Wind m/s | 3.4 | 3.4 | 3.4 | 4.5 | 6.0 | 6.5 | 6.7 | 6.3 | 6.3 | 5.6 | 5.0 | 4.0 |
| Daylight h | 13.4 | 12.9 | 12.3 | 11.6 | 11.0 | 10.7 | 10.8 | 11.3 | 11.9 | 12.6 | 13.2 | 13.6 |
| Record high/low | 22°/-9° | 21°/-9° | 20°/-8° | 18°/-11° | 15°/-14° | 14°/-14° | 13°/-16° | 16°/-14° | 19°/-10° | 20°/-11° | 22°/-9° | 21°/-9° |
| Beach index | 4.1 | 4.2 | 4.6 | 4.7 | 4.4 | 4.3 | 4.2 | 4.3 | 4.4 | 4.5 | 4.6 | 4.4 |
Long-term monthly averages: air from NASA POWER (2001–2020), sea from NOAA OISST (1991–2020); records are the extremes of 2001–2020. How the index works.
Setting
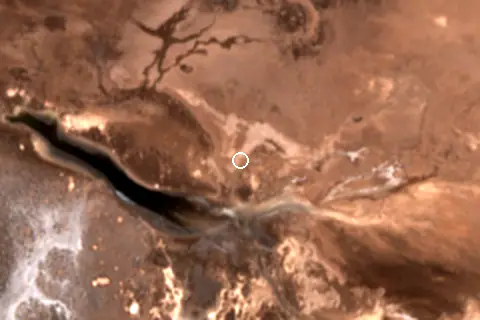
Within 1 km, the land is 100% bare ground, sand or rock (satellite land-cover map, 2021): open dunes, sand or rock. Water makes up 4% of that circle.
- Bare 100%
Land cover: ESA WorldCover 2021 (10 m).
This is not a sea beach, so no sea-temperature normals are shown.
When to go
No month reaches 5.5 on the beach-day index; the best is April at 4.7/10, held back mainly by cool air (highs of 12 °C).
January is the wettest month (65 mm) and June the driest (1 mm); the yearly total is about 270 mm.
Daylight runs from 10.7 hours in June to 13.6 hours in December; in mid-April the sun rises at 07:42 and sets at 19:16 local time.
Getting there
| Airport | Code | Distance | Direction |
|---|---|---|---|
| El Loa Airport Calama | CJC | 186 km | north-west |
| Martín Miguel de Güemes International Airport Salta | SLA | 255 km | south-east |
| Gobernador Horacio Guzman International Airport San Salvador de Jujuy | JUJ | 256 km | south-east |
Straight-line distances from the beach; road distance is usually 20–40% longer.
Reference
Salar de Quisquiro, also known as Salar de Loyoques, is a salt pan in northern Chile and covers an area of around 80 km2 (31 sq mi). The average surface elevation of its drainage basin is 4,430 m (14,530 ft), being the summit of Cerro Purifican at 5,285 m (17,339 ft), the highest point of this basin.
Wikidata item Q22389042.
When people look it up
The EN Wikipedia article was read 360 times in the 12 months to August 2026. Interest peaks in January (40 views), 3.1× the quietest month.
Map and nearby beaches
Loading map…
Open in OpenStreetMap · Directions in Google Maps
| Beach | Distance | Warmest sea | Length | Surface |
|---|---|---|---|---|
| Salar de Quisquiro | – | – | – | – |
| Salar Aguas Calientes I | 20.2 km NW | – | – | – |
| Salar de Aguas Calientes II | 37.8 km SW | – | – | – |
- Salar Aguas Calientes I20.2 km NWCompare
- Salar de Aguas Calientes II37.8 km SWCompare
Data on this page
- Air temperature, rain, cloud, wind, humidity: NASA POWER climatology 2001–2020, 0.5° grid.
- Water body, status and length: Wikidata (CC0).
- Towns and time zone: GeoNames (CC BY 4.0). Airports: OurAirports (public domain). Sunrise and sunset: NOAA solar equations.
- Satellite view: Copernicus Sentinel-2 (ESA), scene S2B_19KFQ_20260924_0_L2A.
- Settlements: GeoNames places with 1,000+ inhabitants.
- Nearest services: OpenStreetMap and Overture Maps places within 20 km.
- Land cover: ESA WorldCover 2021, 10 m (CC BY 4.0).
Data compiled 2026-10-13. Something wrong? Report a data error.