Iceland / South
Reynisfjara Beach
Reynisfjara Beach is a 3.5 km-long sandy beach facing south on the Atlantic Ocean, 60.1 km east of Vestmannaeyjar (South, Iceland). The sea averages 11.5 °C in August, its warmest month, and 7.4 °C in February; it never reaches 21 °C on average.
Average sea surface temperature by month. Current month outlined.

Reference
Reynisfjara is a popular black sand beach in southern Iceland near the town of Vík í Mýrdal. It is part of the Katla UNESCO Global Geopark on privately owned land.
Wikidata item Q115641739 · classified as coast and black sand beach.
Month by month
October at Reynisfjara Beach
Beach-day index 0.9/10 · Iceland median 1.5
| Measure | Jan | Feb | Mar | Apr | May | Jun | Jul | Aug | Sep | Oct | Nov | Dec |
|---|---|---|---|---|---|---|---|---|---|---|---|---|
| Sea °C | 7.5 °C | 7.4 °C | 7.4 °C | 7.5 °C | 8.1 °C | 9.6 °C | 11.0 °C | 11.5 °C | 10.4 °C | 8.9 °C | 8.0 °C | 7.7 °C |
| High °C | 2° | 3° | 3° | 5° | 7° | 10° | 12° | 11° | 9° | 6° | 4° | 3° |
| Low °C | -1° | -1° | -1° | 1° | 4° | 7° | 8° | 8° | 6° | 3° | 1° | -1° |
| Rain mm | 250 | 232 | 222 | 174 | 124 | 120 | 144 | 166 | 229 | 235 | 221 | 251 |
| Cloud % | 78 | 78 | 79 | 79 | 79 | 84 | 85 | 79 | 78 | 76 | 76 | 76 |
| Wind m/s | 8.2 | 8.3 | 7.7 | 7.0 | 5.9 | 5.2 | 4.8 | 5.1 | 6.4 | 6.9 | 7.7 | 7.9 |
| Daylight h | 5.6 | 8.6 | 11.6 | 14.9 | 18.0 | 20.5 | 19.5 | 16.4 | 13.1 | 10.0 | 6.8 | 4.6 |
| Record high/low | 8°/-12° | 8°/-14° | 7°/-11° | 10°/-10° | 14°/-7° | 15°/1° | 17°/4° | 19°/2° | 13°/-2° | 11°/-9° | 9°/-11° | 8°/-13° |
| Beach index | 0.5 | 0.6 | 0.8 | 1.3 | 1.9 | 2.0 | 1.9 | 1.7 | 1.0 | 0.9 | 0.9 | 0.6 |
Long-term monthly averages: air from NASA POWER (2001–2020), sea from NOAA OISST (1991–2020); records are the extremes of 2001–2020. How the index works.
When to go
No month reaches 5.5 on the beach-day index; the best is June at 2.0/10, held back mainly by cool air (highs of 10 °C) and cold water (9.6 °C).
At its warmest the water here is 1.3 °C warmer than the Iceland median for August (10.2 °C).
Across the year the sea averages 8.8 °C, cooler than 92% of the coastal beaches in the atlas.
December is the wettest month (251 mm) and June the driest (120 mm); the yearly total is about 2,370 mm.
Daylight runs from 4.6 hours in December to 20.5 hours in June; in mid-June the sun rises at 03:02 and sets at 23:30 local time.
Orientation, sun and shore
The shore faces south (190°). Open water fills about 47% of the horizon close by, which makes it an open stretch of shore.
The sun sets over the sea in October–March; in mid-December it goes down at 15:30 local time on a bearing of 212°.
Sunrise is over the sea in October–February.
Straight out to the south there is open water for more than 2,000 km, so the beach is exposed to long ocean swell. The beach is on an island of about 114,712 km².
About 1 km offshore the sea is roughly 11 m deep and 45 m at 3 km. Behind the beach the ground is about 2 m above sea level 500 m inland and 12 m at 1.5 km, a flat coastal plain.
Within 1 km, the land is 73% bare ground, sand or rock, 14% grassland and 7% cropland (satellite land-cover map, 2021): open dunes, sand or rock. Water makes up 73% of that circle.
- Bare 73%
- Grass 14%
- Crop 7%
- Wetland 6%
Land cover: ESA WorldCover 2021 (10 m). Orientation from OpenStreetMap land polygons sampled in 36 directions; depths and heights from the GEBCO 2020 grid (about 450 m cells), indicative only.
The sea peaks at 11.5 °C in August. Most swimmers find water below 20 °C cold; a wetsuit is common here.
Average wind speed at 10 m reaches 8.3 m/s in February, the windiest month.
OpenStreetMap shows no lifeguard station within 1 km. Seasonal lifeguard posts are often unmapped, so check on site.
Day length swings from 4.6 h in December to 20.5 h in June.
Photos


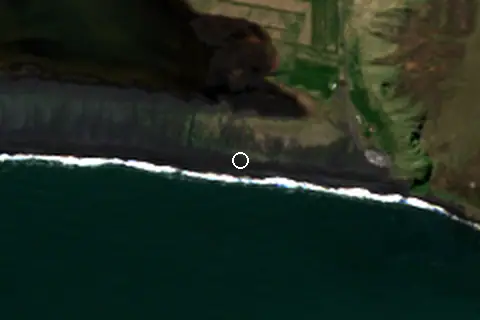
From above
Facilities within 1 km
- 2Restaurants, cafés & bars
- 2Public toilets
- –Showers
- 2Car parks
- –Lifeguard stations
Food and drink mapped within 1 km: 2 restaurants.
Counted within 1 km of the beach (bus stops 1.5 km) from OpenStreetMap features and Overture Maps places, release of 2026-10. Unmapped does not mean absent.
Around the beach
Attractions & museums
- Reynisdrangar attraction 1.5 km E
Nature
- Hálsanefshellir cave entrance 960 m E
Islands in view
- Reynisdrangar 1.5 km E
- Miðsker 2.4 km W
- Stampur 2.4 km W
Getting there
| Airport | Code | Distance | Direction |
|---|---|---|---|
| Reykjavík Domestic Airport Reykjavík | RKV | 162 km | north-west |
| Keflavik International Airport Reykjavík | KEF | 186 km | west |
| Hornafjörður Airport Höfn | HFN | 213 km | north-east |
Straight-line distances from the beach; road distance is usually 20–40% longer.
Local transport: 2 mapped car parks within 1 km.
When people look it up
The EN Wikipedia article was read 52,489 times in the 12 months to August 2026. Interest peaks in February (16,581 views), 7.2× the quietest month.
Map
Loading map…
Data on this page
- Air temperature, rain, cloud, wind, humidity: NASA POWER climatology 2001–2020, 0.5° grid.
- Sea temperature: NOAA OISST v2.1 monthly normals 1991–2020, nearest ocean cell 4.3 km away.
- Beach outline, surface, rules and public facilities: OpenStreetMap contributors (ODbL), feature r13989221; restaurants, cafés, bars and lodging: Overture Maps places (CDLA-Permissive-2.0).
- Water body, status and length: Wikidata (CC0).
- Towns and time zone: GeoNames (CC BY 4.0). Airports: OurAirports (public domain). Sunrise and sunset: NOAA solar equations.
- Photos: Wikimedia Commons, author and licence under each image.
- Satellite view: Copernicus Sentinel-2 (ESA), scene S2C_27VWL_20250520_0_L2A.
- Orientation: OpenStreetMap land polygons (ODbL). Depth and terrain: GEBCO 2020 grid.
- Settlements: GeoNames places with 1,000+ inhabitants.
- Land cover: ESA WorldCover 2021, 10 m (CC BY 4.0).
- Search popularity: about 90.5K Google searches a month for the name (KeywordTool, October 2026).
Data compiled 2026-10-13. Something wrong? Report a data error.