Netherlands / Friesland
Harlingen Strand
Harlingen Strand is a coastal resort area in Friesland, Netherlands on the Wadden Sea. Its longest mapped beach stretches about 617 m. The sea averages 18.7 °C in August, its warmest month, and 4.7 °C in February; it never reaches 21 °C on average.
Average sea surface temperature by month. Current month outlined.

The sea peaks at 18.7 °C in August. Most swimmers find water below 20 °C cold; a wetsuit is common here.
Average wind speed at 10 m reaches 8.8 m/s in January, the windiest month.
OpenStreetMap shows no lifeguard station within 1 km. Seasonal lifeguard posts are often unmapped, so check on site.
Services in the resort
- 60Restaurants, cafés & bars
- 6Public toilets
- –Showers
- 4Drinking water
- 294Car parks
- –Lifeguard stations
- 30Hotels & guesthouses
- 1Campsites
- 9Grocery shops
- 4Water-sports spots
- 1Playgrounds & water parks
- 16Bus stops (1.5 km)
- 2Pharmacies & clinics
- 4Cash machines
- 2Viewpoints
Food and drink mapped within 1 km: 41 restaurants, 10 cafés, 6 bars and 3 fast-food outlets. Accommodation: 30 hotels and guesthouses.
Counted within 1 km of the beach (bus stops 1.5 km) from OpenStreetMap features and Overture Maps places, release of 2026-10. Unmapped does not mean absent.
Month by month
October at Harlingen Strand
Beach-day index 1.9/10 · Netherlands median 2.3
| Measure | Jan | Feb | Mar | Apr | May | Jun | Jul | Aug | Sep | Oct | Nov | Dec |
|---|---|---|---|---|---|---|---|---|---|---|---|---|
| Sea °C | 5.5 °C | 4.7 °C | 5.7 °C | 8.6 °C | 11.7 °C | 15.0 °C | 17.5 °C | 18.7 °C | 16.8 °C | 13.7 °C | 10.5 °C | 7.5 °C |
| High °C | 6° | 5° | 7° | 10° | 13° | 16° | 19° | 19° | 17° | 14° | 10° | 7° |
| Low °C | 4° | 3° | 4° | 7° | 10° | 13° | 16° | 17° | 15° | 11° | 8° | 5° |
| Rain mm | 89 | 71 | 58 | 42 | 59 | 67 | 82 | 96 | 74 | 85 | 86 | 92 |
| Cloud % | 84 | 82 | 76 | 69 | 69 | 73 | 71 | 73 | 75 | 81 | 87 | 87 |
| Wind m/s | 8.8 | 8.2 | 7.5 | 6.3 | 6.3 | 6.0 | 5.9 | 6.2 | 6.9 | 7.9 | 8.2 | 8.6 |
| Daylight h | 8.1 | 9.8 | 11.8 | 13.9 | 15.8 | 16.9 | 16.5 | 14.9 | 12.8 | 10.7 | 8.7 | 7.6 |
| Record high/low | 12°/-3° | 11°/-6° | 13°/-6° | 20°/1° | 21°/5° | 27°/9° | 28°/13° | 27°/13° | 26°/10° | 21°/5° | 16°/0° | 13°/-3° |
| Beach index | 1.6 | 1.9 | 2.2 | 2.6 | 2.5 | 2.4 | 3.8 | 4.3 | 2.9 | 1.9 | 1.7 | 1.6 |
Long-term monthly averages: air from NASA POWER (2001–2020), sea from NOAA OISST (1991–2020); records are the extremes of 2001–2020. How the index works.
When to go
No month reaches 5.5 on the beach-day index; the best is August at 4.3/10, held back mainly by cool air (highs of 19 °C) and cloud cover (73%).
Across the year the sea averages 11.3 °C, cooler than 86% of the coastal beaches in the atlas.
August is the wettest month (96 mm) and April the driest (42 mm); the yearly total is about 900 mm.
Daylight runs from 7.6 hours in December to 16.9 hours in June; in mid-August the sun rises at 06:17 and sets at 21:08 local time.
Orientation, sun and shore
The shore faces west (265°). Open water fills about 50% of the horizon close by, which makes it an open stretch of shore.
The sun sets over the sea in every month; in mid-June it goes down at 22:06 local time on a bearing of 313°.
The opposite shore is only about 500 m away to the west, which keeps the water sheltered from big waves.
About 1 km offshore the sea is roughly 5 m deep and 3 m at 3 km, a shallow, gently shelving sea floor. Behind the beach the ground is about 3 m above sea level 500 m inland and 1 m at 1.5 km, a flat coastal plain.
Within 1 km, the land is 72% built-up land, 15% grassland and 10% tree cover (satellite land-cover map, 2021): an urban beach. Water makes up 54% of that circle.
- Built 72%
- Grass 15%
- Tree 10%
Land cover: ESA WorldCover 2021 (10 m). Orientation from OpenStreetMap land polygons sampled in 36 directions; depths and heights from the GEBCO 2020 grid (about 450 m cells), indicative only.
Getting there
| Airport | Code | Distance | Direction |
|---|---|---|---|
| Groningen Airport Eelde Groningen | GRQ | 77.8 km | east |
| Amsterdam Airport Schiphol Amsterdam | AMS | 106 km | south-west |
| Rotterdam The Hague Airport Rotterdam | RTM | 151 km | south-west |
Straight-line distances from the beach; road distance is usually 20–40% longer.
Local transport: 16 bus stops within 1.5 km, rail station Harlingen Haven (190 m), rail station Harlingen (910 m), ferry terminal Harlingen (200 m) and 294 mapped car parks within 1 km.
4 towns and villages of 1,000+ people lie within 10 km (about 32.2K residents); within 30 km there are 46 (about 316.1K).
Photos


![[HARLINGEN (NL): https://de.wikipedia.org/wiki/Harlingen" de.wikipedia.org/wiki/Harlingen]](https://thumb.wikimedia.org/wikipedia/commons/thumb/a/a8/DSC01532-_HARLINGEN_%28NL%29_%2830623482853%29.jpg/1280px-DSC01532-_HARLINGEN_%28NL%29_%2830623482853%29.jpg)
![[HARLINGEN (NL): https://de.wikipedia.org/wiki/Harlingen" de.wikipedia.org/wiki/Harlingen]](https://thumb.wikimedia.org/wikipedia/commons/thumb/0/0d/DSC01533-_HARLINGEN_%28NL%29_%2831394775336%29.jpg/1280px-DSC01533-_HARLINGEN_%28NL%29_%2831394775336%29.jpg)
![[HARLINGEN (NL): https://de.wikipedia.org/wiki/Harlingen" de.wikipedia.org/wiki/Harlingen]](https://thumb.wikimedia.org/wikipedia/commons/thumb/2/27/DSC01535-_HARLINGEN_%28NL%29_%2830609609504%29.jpg/1280px-DSC01535-_HARLINGEN_%28NL%29_%2830609609504%29.jpg)
![[HARLINGEN (NL): https://de.wikipedia.org/wiki/Harlingen" de.wikipedia.org/wiki/Harlingen]](https://thumb.wikimedia.org/wikipedia/commons/thumb/2/28/DSC01534-_HARLINGEN_%28NL%29_%2830623482603%29.jpg/1280px-DSC01534-_HARLINGEN_%28NL%29_%2830623482603%29.jpg)
![[HARLINGEN (NL): https://de.wikipedia.org/wiki/Harlingen" de.wikipedia.org/wiki/Harlingen]](https://thumb.wikimedia.org/wikipedia/commons/thumb/9/9b/DSC01536-_HARLINGEN_%28NL%29_%2831394774886%29.jpg/1280px-DSC01536-_HARLINGEN_%28NL%29_%2831394774886%29.jpg)
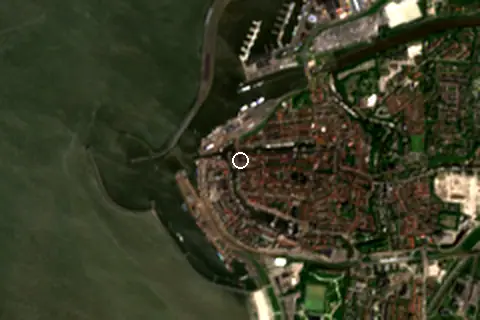
From above
Reference
Harlingen Strand has an article on the NL Wikipedia: Harlinger Strand.
Wikidata item Q2178650.
Around the beach
Attractions & museums
- Els Jansma museum 120 m SW
- Hannemahuis museum 340 m E
Lighthouses & piers
- Sassteiger pier 230 m W
- Multifunctionele Steiger Willemkade pier 340 m SW
- Rijkssteiger pier 380 m N
- Sportvissteiger pier 390 m N
- Zuiderpier steiger pier 510 m S
- Zaagtandsteiger pier 590 m N
Diving & boat hire
- Ontmoeting-zeilreizen 130 m N
- Noordvaarder Zeilreizen 310 m S
- Zonnewind Zeilreizen 490 m S
- Ouwe Seun 860 m E
Campsites
- Camperplaats Vissershaven Tjerk Hiddessluizen 530 m NE
When people look it up
The NL Wikipedia article was read 305 times in the 12 months to August 2026. Interest peaks in July (53 views), 13.3× the quietest month.
Map
Loading map…
Data on this page
- Air temperature, rain, cloud, wind, humidity: NASA POWER climatology 2001–2020, 0.5° grid.
- Sea temperature: NOAA OISST v2.1 monthly normals 1991–2020, nearest ocean cell 6.2 km away.
- Beach outline, surface, rules and public facilities: OpenStreetMap contributors (ODbL), feature w522018972; restaurants, cafés, bars and lodging: Overture Maps places (CDLA-Permissive-2.0).
- Water body, status and length: Wikidata (CC0).
- Towns and time zone: GeoNames (CC BY 4.0). Airports: OurAirports (public domain). Sunrise and sunset: NOAA solar equations.
- Photos: Wikimedia Commons, author and licence under each image.
- Satellite view: Copernicus Sentinel-2 (ESA), scene S2B_31UFV_20240514_0_L2A.
- Orientation: OpenStreetMap land polygons (ODbL). Depth and terrain: GEBCO 2020 grid.
- Settlements: GeoNames places with 1,000+ inhabitants.
- Land cover: ESA WorldCover 2021, 10 m (CC BY 4.0).
- Search popularity: about 4.4K Google searches a month for the name (KeywordTool, October 2026).
Data compiled 2026-10-13. Something wrong? Report a data error.