Peru / Ica
Playa Los Choros
Playa Los Choros is a beach facing south, 12.4 km south-west of Paracas (Ica, Peru). The sea averages 20.7 °C in February, its warmest month, and 16.0 °C in September; it never reaches 21 °C on average.
Average sea surface temperature by month. Current month outlined.
Month by month
November at Playa Los Choros
Beach-day index 6.4/10 · Peru median 6.4
| Measure | Jan | Feb | Mar | Apr | May | Jun | Jul | Aug | Sep | Oct | Nov | Dec |
|---|---|---|---|---|---|---|---|---|---|---|---|---|
| Sea °C | 20.3 °C | 20.7 °C | 20.3 °C | 18.9 °C | 18.3 °C | 17.6 °C | 16.8 °C | 16.2 °C | 16.0 °C | 16.2 °C | 17.2 °C | 18.6 °C |
| High °C | 25° | 25° | 25° | 24° | 23° | 21° | 21° | 21° | 21° | 22° | 23° | 23° |
| Low °C | 18° | 20° | 19° | 18° | 16° | 14° | 14° | 14° | 14° | 14° | 15° | 17° |
| Rain mm | 5 | 6 | 4 | 1 | 1 | 1 | 1 | 1 | 1 | 2 | 3 | 5 |
| Cloud % | 74 | 76 | 70 | 55 | 60 | 75 | 80 | 79 | 73 | 70 | 70 | 76 |
| Wind m/s | 3.8 | 3.4 | 3.4 | 3.5 | 3.7 | 4.0 | 4.2 | 4.2 | 4.2 | 4.1 | 4.0 | 3.8 |
| Daylight h | 12.9 | 12.6 | 12.2 | 11.8 | 11.5 | 11.3 | 11.4 | 11.6 | 12.0 | 12.4 | 12.8 | 12.9 |
| Record high/low | 28°/16° | 28°/17° | 28°/17° | 27°/15° | 26°/13° | 25°/13° | 26°/12° | 26°/11° | 26°/11° | 26°/12° | 26°/12° | 28°/14° |
| Beach index | 8.2 | 8.5 | 8.4 | 7.8 | 7.0 | 6.0 | 5.4 | 5.3 | 5.5 | 5.8 | 6.4 | 7.1 |
Long-term monthly averages: air from NASA POWER (2001–2020), sea from NOAA OISST (1991–2020); records are the extremes of 2001–2020. How the index works.
When to go
The beach-day index peaks in January–March; February scores 8.5/10 with highs of 25 °C, sea at 20.7 °C and 6 mm of rain.
In February that is 0.7 points above the median of the 340 beaches in Peru covered by this atlas.
At its warmest the water here is 0.8 °C cooler than the Peru median for February (21.5 °C).
Across the year the sea averages 18.1 °C, cooler than 57% of the coastal beaches in the atlas.
February is the wettest month (6 mm) and April the driest (1 mm); the yearly total is about 30 mm.
Daylight runs from 11.3 hours in June to 12.9 hours in December; in mid-February the sun rises at 06:03 and sets at 18:36 local time.
Orientation, sun and shore
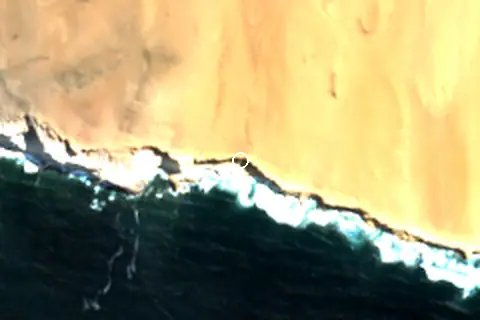
The shore faces south (185°). Open water fills about 39% of the horizon close by, which makes it an open stretch of shore.
The sun sets over the sea in November–January; in mid-December it goes down at 18:28 local time on a bearing of 246°.
Straight out to the south there is open water for more than 2,000 km, so the beach is exposed to long ocean swell.
About 1 km offshore the sea is roughly 328 m deep and 66 m at 3 km, so deep water starts close to shore. Behind the beach the ground is about 136 m above sea level 500 m inland and 176 m at 1.5 km, so the beach is backed by steep slopes or cliffs.
Within 1 km, the land is 100% bare ground, sand or rock (satellite land-cover map, 2021): open dunes, sand or rock. Water makes up 40% of that circle.
- Bare 100%
Land cover: ESA WorldCover 2021 (10 m). Orientation from OpenStreetMap land polygons sampled in 36 directions; depths and heights from the GEBCO 2020 grid (about 450 m cells), indicative only.
Nearest services
The nearest place to eat or drink is 6.8 km east (La Tia Fela) and the nearest fuel station is 18.0 km north-east (PARACAS PUMA).
| Service | Nearest mapped | Distance | Direction |
|---|---|---|---|
| Food and drink | La Tia Fela | 6.8 km | east |
| Accommodation | Reserva De Paracas Mirador De Flamencos | 11.7 km | north-east |
| Fuel station | PARACAS PUMA | 18.0 km | north-east |
| Car park | — | 2.9 km | east |
| Public toilets | — | 6.0 km | east |
| Bus stop | — | 16.7 km | north-east |
Straight-line distance to the nearest feature within 20 km, from OpenStreetMap and Overture Maps places. A category is missing when nothing is mapped within 20 km.
Getting there
| Airport | Code | Distance | Direction |
|---|---|---|---|
| Maria Reiche Neuman Airport Nazca | NZC | 185 km | south-east |
| Jorge Chávez International Airport Lima | LIM | 225 km | north |
| Air Force Colonel Alfredo Mendivil Duarte Airport Ayacucho | AYP | 249 km | east |
Straight-line distances from the beach; road distance is usually 20–40% longer.
No town of 1,000+ people lies within 10 km; within 30 km there are 3 (about 63.1K).
Map and nearby beaches
Loading map…
Open in OpenStreetMap · Directions in Google Maps
| Beach | Distance | Warmest sea | Length | Surface |
|---|---|---|---|---|
| Playa Los Choros | – | 20.7 °C | – | – |
| Playa Lira | 3.5 km NW | 20.7 °C | – | – |
| Playa El Boquerón | 3.8 km NW | 20.7 °C | – | – |
| Playa La Mina | 5.9 km E | 20.7 °C | 203 m | – |
| Playa Roja | 7.4 km E | 20.7 °C | – | – |
| Playa Culebra | 7.6 km N | 20.7 °C | – | – |
| Playa El Peligro | 10.6 km NW | 20.7 °C | – | – |
- Playa Lira3.5 km NWCompare
- Playa El Boquerón3.8 km NWCompare
- Playa La Mina5.9 km ECompare
- Playa Roja7.4 km ECompare
- Playa Culebra7.6 km NCompare
- Playa El Peligro10.6 km NWCompare
- Playa Supay10.8 km ECompare
- Playa Yumaque11.1 km ECompare
Data on this page
- Air temperature, rain, cloud, wind, humidity: NASA POWER climatology 2001–2020, 0.5° grid.
- Sea temperature: NOAA OISST v2.1 monthly normals 1991–2020, nearest ocean cell 3.9 km away.
- Water body, status and length: Wikidata (CC0).
- Towns and time zone: GeoNames (CC BY 4.0). Airports: OurAirports (public domain). Sunrise and sunset: NOAA solar equations.
- Satellite view: Copernicus Sentinel-2 (ESA), scene S2B_18LUK_20250404_0_L2A.
- Orientation: OpenStreetMap land polygons (ODbL). Depth and terrain: GEBCO 2020 grid.
- Settlements: GeoNames places with 1,000+ inhabitants.
- Nearest services: OpenStreetMap and Overture Maps places within 20 km.
- Land cover: ESA WorldCover 2021, 10 m (CC BY 4.0).
Data compiled 2026-10-13. Something wrong? Report a data error.