Portugal / Faro
Praia Verde
Praia Verde is a 602 m-long sandy beach facing south, 1.9 km east of Altura (Faro, Portugal). The sea averages 22.2 °C in August, its warmest month, and 15.3 °C in February; it is 21 °C or warmer in July–September.
Average sea surface temperature by month. Current month outlined.

Month by month
October at Praia Verde
Beach-day index 8.1/10 · Portugal median 6.6
| Measure | Jan | Feb | Mar | Apr | May | Jun | Jul | Aug | Sep | Oct | Nov | Dec |
|---|---|---|---|---|---|---|---|---|---|---|---|---|
| Sea °C | 15.9 °C | 15.3 °C | 15.6 °C | 16.5 °C | 17.9 °C | 19.9 °C | 21.6 °C | 22.2 °C | 21.5 °C | 20.2 °C | 18.4 °C | 17.0 °C |
| High °C | 15° | 16° | 19° | 22° | 27° | 33° | 36° | 36° | 31° | 25° | 18° | 15° |
| Low °C | 4° | 5° | 7° | 9° | 13° | 17° | 19° | 20° | 17° | 13° | 8° | 5° |
| Rain mm | 44 | 46 | 55 | 51 | 27 | 7 | 1 | 3 | 21 | 67 | 74 | 56 |
| Cloud % | 50 | 47 | 50 | 50 | 41 | 27 | 15 | 17 | 30 | 44 | 47 | 49 |
| Wind m/s | 3.9 | 4.1 | 4.2 | 4.0 | 3.9 | 3.8 | 3.9 | 3.7 | 3.3 | 3.7 | 4.0 | 4.0 |
| Daylight h | 9.9 | 10.8 | 11.9 | 13.1 | 14.1 | 14.7 | 14.5 | 13.6 | 12.5 | 11.3 | 10.2 | 9.6 |
| Record high/low | 23°/-5° | 24°/-3° | 31°/-1° | 32°/3° | 38°/5° | 43°/10° | 45°/13° | 45°/14° | 44°/12° | 37°/4° | 29°/-2° | 22°/-3° |
| Beach index | 3.4 | 3.2 | 4.0 | 5.6 | 7.8 | 8.0 | 7.0 | 7.3 | 9.1 | 8.1 | 4.6 | 3.7 |
Long-term monthly averages: air from NASA POWER (2001–2020), sea from NOAA OISST (1991–2020); records are the extremes of 2001–2020. How the index works.
When to go
The beach-day index peaks in September; September scores 9.1/10 with highs of 31 °C, sea at 21.5 °C and 21 mm of rain.
In September that is 1.1 points above the median of the 344 beaches in Portugal covered by this atlas.
At its warmest the water here is 3.3 °C warmer than the Portugal median for August (18.9 °C).
Across the year the sea averages 18.5 °C, cooler than 53% of the coastal beaches in the atlas.
November is the wettest month (74 mm) and July the driest (1 mm); the yearly total is about 450 mm.
Daylight runs from 9.6 hours in December to 14.7 hours in June; in mid-September the sun rises at 07:10 and sets at 19:39 local time.
Orientation, sun and shore
The shore faces south (170°). Open water fills about 47% of the horizon close by, which makes it an open stretch of shore.
The sun sets over the sea in November–February; in mid-December it goes down at 17:13 local time on a bearing of 241°.
Sunrise is over the sea in October–March.
Straight out to the south about 300 km of open sea lies before the next coast, enough for large swells to build.
About 1 km offshore the sea is roughly 9 m deep and 12 m at 3 km, a shallow, gently shelving sea floor. Behind the beach the ground is about 23 m above sea level 500 m inland and 26 m at 1.5 km.
Within 1 km, the land is 37% grassland, 34% tree cover and 17% bare ground, sand or rock (satellite land-cover map, 2021): a largely natural setting. Water makes up 46% of that circle.
- Grass 37%
- Tree 34%
- Bare 17%
- Built 10%
Land cover: ESA WorldCover 2021 (10 m). Orientation from OpenStreetMap land polygons sampled in 36 directions; depths and heights from the GEBCO 2020 grid (about 450 m cells), indicative only.
Bathing water quality
The official EU bathing-water site “Praia Verde”, 100 m from the beach centre, was rated Excellent for the 2025 season. It was Excellent in 11 of its 11 classified seasons since 2015.
- 2015Excellent
- 2016Excellent
- 2017Excellent
- 2018Excellent
- 2019Excellent
- 2020Excellent
- 2021Excellent
- 2022Excellent
- 2023Excellent
- 2024Excellent
- 2025Excellent
Source: European Environment Agency, EU Bathing Water Directive assessments · national site profile. Classes are based on four seasons of bacteriological sampling.
Average daytime highs reach 36 °C in July.
OpenStreetMap shows no lifeguard station within 1 km. Seasonal lifeguard posts are often unmapped, so check on site.
Photos


From above
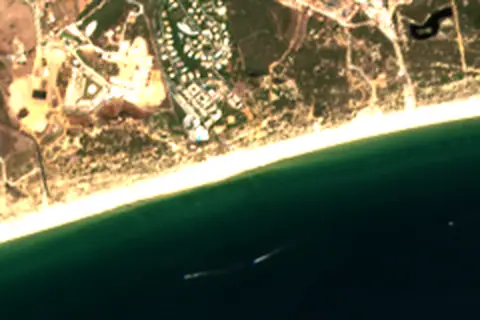
Facilities within 1 km
- 10Restaurants, cafés & bars
- 1Public toilets
- –Showers
- 20Car parks
- –Lifeguard stations
- 7Hotels & guesthouses
- 6Bus stops (1.5 km)
Food and drink mapped within 1 km: 8 restaurants and 2 bars. Accommodation: 7 hotels and guesthouses.
Counted within 1 km of the beach (bus stops 1.5 km) from OpenStreetMap features and Overture Maps places, release of 2026-10. Unmapped does not mean absent.
Getting there
| Airport | Code | Distance | Direction |
|---|---|---|---|
| Faro - Gago Coutinho International Airport Faro | FAO | 47.0 km | west |
| Portimão Airport Portimão | PRM | 98.0 km | west |
| Jerez Airport Jerez de la Frontera | XRY | 135 km | east |
Straight-line distances from the beach; road distance is usually 20–40% longer.
Local transport: 6 bus stops within 1.5 km and 20 mapped car parks within 1 km.
7 towns and villages of 1,000+ people lie within 10 km (about 49.1K residents); within 30 km there are 20 (about 145.7K).
Reference
Praia Verde has an article on the PT Wikipedia: Praia Verde (Castro Marim).
Wikidata item Q10352522.
When people look it up
The PT Wikipedia article was read 3,439 times in the 12 months to August 2026. Interest peaks in August (994 views), 16.0× the quietest month.
Map
Loading map…
Data on this page
- Air temperature, rain, cloud, wind, humidity: NASA POWER climatology 2001–2020, 0.5° grid.
- Sea temperature: NOAA OISST v2.1 monthly normals 1991–2020, nearest ocean cell 10.7 km away.
- Beach outline, surface, rules and public facilities: OpenStreetMap contributors (ODbL), feature w79503288; restaurants, cafés, bars and lodging: Overture Maps places (CDLA-Permissive-2.0).
- Water body, status and length: Wikidata (CC0).
- Towns and time zone: GeoNames (CC BY 4.0). Airports: OurAirports (public domain). Sunrise and sunset: NOAA solar equations.
- Photos: Wikimedia Commons, author and licence under each image.
- Satellite view: Copernicus Sentinel-2 (ESA), scene S2A_29SPB_20230730_0_L2A.
- Orientation: OpenStreetMap land polygons (ODbL). Depth and terrain: GEBCO 2020 grid.
- Bathing-water quality: European Environment Agency (site PTCU8X).
- Settlements: GeoNames places with 1,000+ inhabitants.
- Land cover: ESA WorldCover 2021, 10 m (CC BY 4.0).
- Search popularity: about 880 Google searches a month for the name (KeywordTool, October 2026).
Data compiled 2026-10-13. Something wrong? Report a data error.