Mexico / Quintana Roo
Playa Caracol
Playa Caracol is a 783 m-long sandy beach facing north-east, 10.5 km south of Isla Mujeres (Quintana Roo, Mexico). The sea averages 29.2 °C in September, its warmest month, and 26.4 °C in February; it stays at 21 °C or above all year.
Average sea surface temperature by month. Current month outlined.

Month by month
October at Playa Caracol
Beach-day index 7.6/10 · Mexico median 8.4
| Measure | Jan | Feb | Mar | Apr | May | Jun | Jul | Aug | Sep | Oct | Nov | Dec |
|---|---|---|---|---|---|---|---|---|---|---|---|---|
| Sea °C | 26.5 °C | 26.4 °C | 26.4 °C | 27.0 °C | 27.8 °C | 28.4 °C | 28.7 °C | 29.1 °C | 29.2 °C | 28.8 °C | 28.0 °C | 27.1 °C |
| High °C | 25° | 26° | 26° | 27° | 28° | 29° | 29° | 29° | 29° | 29° | 27° | 26° |
| Low °C | 24° | 25° | 25° | 26° | 27° | 28° | 29° | 29° | 29° | 28° | 26° | 25° |
| Rain mm | 59 | 46 | 38 | 39 | 101 | 167 | 82 | 102 | 154 | 188 | 103 | 64 |
| Cloud % | 53 | 43 | 38 | 37 | 44 | 59 | 50 | 52 | 58 | 58 | 53 | 50 |
| Wind m/s | 6.6 | 6.5 | 6.7 | 6.3 | 5.9 | 5.6 | 4.6 | 4.6 | 4.8 | 6.0 | 6.5 | 6.4 |
| Daylight h | 11.0 | 11.4 | 12.0 | 12.6 | 13.1 | 13.4 | 13.3 | 12.9 | 12.3 | 11.7 | 11.2 | 10.9 |
| Record high/low | 28°/20° | 27°/20° | 28°/20° | 28°/22° | 29°/23° | 30°/26° | 30°/27° | 31°/27° | 30°/26° | 30°/24° | 29°/21° | 28°/21° |
| Beach index | 8.6 | 8.8 | 8.9 | 8.9 | 8.4 | 7.8 | 8.7 | 8.6 | 8.1 | 7.6 | 8.2 | 8.6 |
Long-term monthly averages: air from NASA POWER (2001–2020), sea from NOAA OISST (1991–2020); records are the extremes of 2001–2020. How the index works.
When to go
The beach-day index peaks in July–August and December–May; March scores 8.9/10 with highs of 26 °C, sea at 26.4 °C and 38 mm of rain.
In March that is 0.3 points below the median of the 345 beaches in Mexico covered by this atlas.
At its warmest the water here is 0.5 °C cooler than the Mexico median for September (29.7 °C).
Across the year the sea averages 27.8 °C, warmer than 88% of the coastal beaches in the atlas.
October is the wettest month (188 mm) and March the driest (38 mm); the yearly total is about 1,140 mm.
Daylight runs from 10.9 hours in December to 13.4 hours in June; in mid-March the sun rises at 06:56 and sets at 18:56 local time.
Orientation, sun and shore
The shore faces north-east (40°). Open water fills about 69% of the horizon close by, which makes it an exposed spot with water on most sides.
The sun sets over the sea in April–August; in mid-June it goes down at 19:29 local time on a bearing of 295°.
Sunrise is over the sea in every month.
Straight out to the north-east about 500 km of open sea lies before the next coast, enough for large swells to build.
About 1 km offshore the sea is roughly 6 m deep and 12 m at 3 km, a shallow, gently shelving sea floor. Behind the beach the ground is about 0 m above sea level 500 m inland and 0 m at 1.5 km, a flat coastal plain.
Within 1 km, the land is 75% built-up land, 20% bare ground, sand or rock and 3% grassland (satellite land-cover map, 2021): an urban beach. Water makes up 80% of that circle.
- Built 75%
- Bare 20%
- Grass 3%
Land cover: ESA WorldCover 2021 (10 m). Orientation from OpenStreetMap land polygons sampled in 36 directions; depths and heights from the GEBCO 2020 grid (about 450 m cells), indicative only.
The beach is tagged as supervised.
Photos


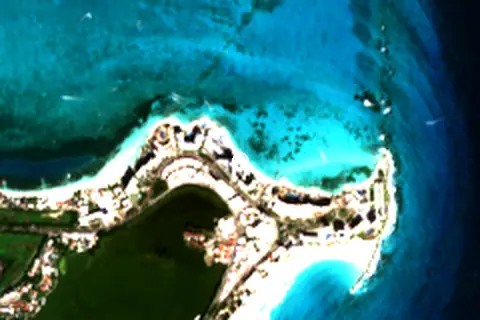
From above
Facilities within 1 km
- 141Restaurants, cafés & bars
- 2Public toilets
- –Showers
- 12Car parks
- –Lifeguard stations
- 59Hotels & guesthouses
- 7Grocery shops
- 12Bus stops (1.5 km)
- 3Pharmacies & clinics
- 7Cash machines
- 1Historic sites
Food and drink mapped within 1 km: 104 restaurants, 9 cafés, 27 bars and 1 fast-food outlet. Accommodation: 59 hotels and guesthouses.
Counted within 1 km of the beach (bus stops 1.5 km) from OpenStreetMap features and Overture Maps places, release of 2026-10. Unmapped does not mean absent.
Around the beach
Attractions & museums
- Museo Musa Isla Mujeres museum 360 m NW
- Aquarium Interactive, plaza La Isla Cancún attraction 430 m W
- Parque Maya Cancún attraction 480 m SE
- Dolphin Connection Mx Cancun attraction 610 m SE
Historic sites
- Hard Rock Café Guitar monument 600 m S
Islands in view
- Pok Ta Pok 2.2 km SW
Lighthouses & piers
- Faro lighthouse 680 m E
- El Faro lighthouse 720 m E
Getting there
| Airport | Code | Distance | Direction |
|---|---|---|---|
| Cancún International Airport Cancún | CUN | 17.1 km | south-west |
| Cozumel International Airport Cozumel | CZM | 71.8 km | south |
| Felipe Carrillo Puerto International Airport Tulum Tulum | TQO | 144 km | south-west |
Straight-line distances from the beach; road distance is usually 20–40% longer.
Local transport: 12 bus stops within 1.5 km, ferry terminal Playa Caracol (190 m) and 12 mapped car parks within 1 km.
No town of 1,000+ people lies within 10 km; within 30 km there are 4 (about 919K).
Map and nearby beaches
Loading map…
Open in OpenStreetMap · Directions in Google Maps
| Beach | Distance | Warmest sea | Length | Surface |
|---|---|---|---|---|
| Playa Caracol | – | 29.2 °C | 783 m | Sand |
| Playa Tortugas | 2.4 km W | 29.2 °C | 281 m | Sand |
| Playa Langosta | 3.9 km W | 29.2 °C | 998 m | Sand |
| Playa Delfines | 9.1 km S | 29.2 °C | – | Sand |
| Playa Norte | 13.7 km N | 29.0 °C | – | – |
- Playa Tortugas2.4 km WCompare
- Playa Langosta3.9 km WCompare
- Playa Delfines9.1 km SCompare
- Playa Norte13.7 km NCompare
Data on this page
- Air temperature, rain, cloud, wind, humidity: NASA POWER climatology 2001–2020, 0.5° grid.
- Sea temperature: NOAA OISST v2.1 monthly normals 1991–2020, nearest ocean cell 12.6 km away.
- Beach outline, surface, rules and public facilities: OpenStreetMap contributors (ODbL), feature w1154140709; restaurants, cafés, bars and lodging: Overture Maps places (CDLA-Permissive-2.0).
- Water body, status and length: Wikidata (CC0).
- Towns and time zone: GeoNames (CC BY 4.0). Airports: OurAirports (public domain). Sunrise and sunset: NOAA solar equations.
- Photos: Wikimedia Commons, author and licence under each image.
- Satellite view: Copernicus Sentinel-2 (ESA), scene S2C_16QEJ_20251226_0_L2A.
- Orientation: OpenStreetMap land polygons (ODbL). Depth and terrain: GEBCO 2020 grid.
- Settlements: GeoNames places with 1,000+ inhabitants.
- Land cover: ESA WorldCover 2021, 10 m (CC BY 4.0).
- Search popularity: about 22.2K Google searches a month for the name (KeywordTool, October 2026).
Data compiled 2026-10-13. Something wrong? Report a data error.