United States / Oregon
Lone Ranch Beach
Lone Ranch Beach is a beach facing south-west, 7.0 km north-west of Brookings (Oregon, United States). The sea averages 12.0 °C in August, its warmest month, and 10.5 °C in March; it never reaches 21 °C on average.
Average sea surface temperature by month. Current month outlined.

Reference
Lone Ranch Beach is a beach administered by the Oregon Parks and Recreation Department, as it is part of the Samuel H. Boardman State Scenic Corridor.
Wikidata item Q17035037.
Month by month
November at Lone Ranch Beach
Beach-day index 1.8/10 · United States median 3.3
| Measure | Jan | Feb | Mar | Apr | May | Jun | Jul | Aug | Sep | Oct | Nov | Dec |
|---|---|---|---|---|---|---|---|---|---|---|---|---|
| Sea °C | 10.6 °C | 10.6 °C | 10.5 °C | 10.6 °C | 10.7 °C | 10.8 °C | 11.2 °C | 12.0 °C | 11.8 °C | 11.7 °C | 11.6 °C | 11.0 °C |
| High °C | 7° | 8° | 10° | 12° | 16° | 21° | 28° | 28° | 25° | 18° | 10° | 7° |
| Low °C | 0° | 0° | 1° | 3° | 6° | 8° | 11° | 11° | 9° | 5° | 2° | 0° |
| Rain mm | 203 | 162 | 186 | 112 | 57 | 32 | 5 | 8 | 34 | 98 | 192 | 282 |
| Cloud % | 75 | 73 | 75 | 70 | 63 | 54 | 45 | 48 | 50 | 57 | 71 | 75 |
| Wind m/s | 2.0 | 1.9 | 1.9 | 1.8 | 1.7 | 1.9 | 1.9 | 1.8 | 1.8 | 1.8 | 1.9 | 2.1 |
| Daylight h | 9.4 | 10.6 | 11.9 | 13.3 | 14.5 | 15.2 | 15.0 | 13.9 | 12.6 | 11.2 | 9.9 | 9.1 |
| Record high/low | 19°/-14° | 19°/-7° | 23°/-5° | 28°/-4° | 32°/-1° | 39°/3° | 40°/6° | 41°/7° | 39°/3° | 34°/-3° | 26°/-7° | 14°/-12° |
| Beach index | 1.6 | 2.0 | 1.8 | 2.4 | 2.9 | 4.8 | 7.0 | 7.0 | 6.6 | 2.9 | 1.8 | 1.2 |
Long-term monthly averages: air from NASA POWER (2001–2020), sea from NOAA OISST (1991–2020); records are the extremes of 2001–2020. How the index works.
When to go
The beach-day index peaks in July–September; July scores 7.0/10 with highs of 28 °C, sea at 11.2 °C and 5 mm of rain.
In July that is 0.9 points below the median of the 2,466 beaches in United States covered by this atlas.
At its warmest the water here is 10.5 °C cooler than the United States median for August (22.5 °C).
Across the year the sea averages 11.1 °C, cooler than 87% of the coastal beaches in the atlas.
December is the wettest month (282 mm) and July the driest (5 mm); the yearly total is about 1,370 mm.
Daylight runs from 9.1 hours in December to 15.2 hours in June; in mid-July the sun rises at 05:53 and sets at 20:52 local time.
Orientation, sun and shore
The shore faces south-west (235°). Open water fills about 39% of the horizon close by, which makes it an open stretch of shore.
The sun sets over the sea in every month; in mid-June it goes down at 20:54 local time on a bearing of 303°.
Straight out to the south-west there is open water for more than 2,000 km, so the beach is exposed to long ocean swell.
About 1 km offshore the sea is roughly 24 m deep and 49 m at 3 km. Behind the beach the ground is about 79 m above sea level 500 m inland and 117 m at 1.5 km, so the beach is backed by steep slopes or cliffs.
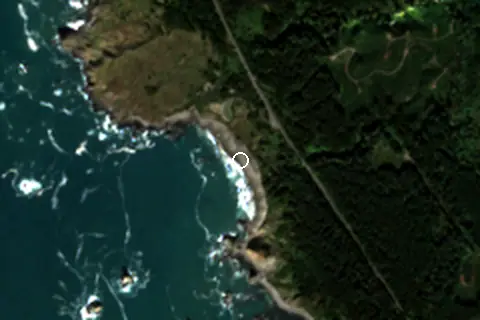
Within 1 km, the land is 74% tree cover, 22% grassland and 3% bare ground, sand or rock (satellite land-cover map, 2021): a largely natural setting. Water makes up 36% of that circle.
- Tree 74%
- Grass 22%
- Bare 3%
Land cover: ESA WorldCover 2021 (10 m). Orientation from OpenStreetMap land polygons sampled in 36 directions; depths and heights from the GEBCO 2020 grid (about 450 m cells), indicative only.
The sea peaks at 12.0 °C in August. Most swimmers find water below 20 °C cold; a wetsuit is common here.
Photos


From above
Facilities within 1 km
- –Restaurants, cafés & bars
- 1Public toilets
- –Showers
- 3Car parks
- –Lifeguard stations
- 1Viewpoints
Counted within 1 km of the beach (bus stops 1.5 km) from OpenStreetMap features and Overture Maps places, release of 2026-10. Unmapped does not mean absent.
Around the beach
Viewpoints
- Cape Ferrelo Viewpoint 970 m N
Islands in view
- Rainbow Island 1.6 km S
Getting there
| Airport | Code | Distance | Direction |
|---|---|---|---|
| Jack Mc Namara Field Airport Crescent City | CEC | 36.6 km | south |
| Rogue Valley International-Medford Airport Medford | MFR | 125 km | east |
| California Redwood Coast-Humboldt County Airport Arcata/Eureka | ACV | 126 km | south |
Straight-line distances from the beach; road distance is usually 20–40% longer.
Local transport: 3 mapped car parks within 1 km.
2 towns and villages of 1,000+ people lie within 10 km (about 8.9K residents); within 30 km there are 2 (about 8.9K).
When people look it up
The EN Wikipedia article was read 1,013 times in the 12 months to August 2026. Interest peaks in April (141 views), 3.1× the quietest month.
Map and nearby beaches
Loading map…
Open in OpenStreetMap · Directions in Google Maps
| Beach | Distance | Warmest sea | Length | Surface |
|---|---|---|---|---|
| Lone Ranch Beach | – | 12.0 °C | – | – |
| Harris Beach | 4.9 km SE | 12.0 °C | 692 m | Sand |
| Pelican State Beach | 16.1 km SE | 12.4 °C | 1.0 km | – |
| Kellogg Road Beach | 27.7 km SE | 12.4 °C | – | – |
| Gold Beach | 35.0 km N | 11.7 °C | 3.4 km | – |
| Pebble Beach | 38.2 km S | 12.4 °C | 1.0 km | Sand |
| Barley Beach | 40.4 km N | 11.7 °C | 2.2 km | – |
- Harris Beach4.9 km SECompare
- Pelican State Beach16.1 km SECompare
- Kellogg Road Beach27.7 km SECompare
- Gold Beach35.0 km NCompare
- Pebble Beach38.2 km SCompare
- Barley Beach40.4 km NCompare
- Agate Beach41.9 km NCompare
- Wakeman Beach43.7 km NCompare
Data on this page
- Air temperature, rain, cloud, wind, humidity: NASA POWER climatology 2001–2020, 0.5° grid.
- Sea temperature: NOAA OISST v2.1 monthly normals 1991–2020, nearest ocean cell 4.0 km away.
- Beach outline, surface, rules and public facilities: OpenStreetMap contributors (ODbL), feature n357303440; restaurants, cafés, bars and lodging: Overture Maps places (CDLA-Permissive-2.0).
- Water body, status and length: Wikidata (CC0).
- Towns and time zone: GeoNames (CC BY 4.0). Airports: OurAirports (public domain). Sunrise and sunset: NOAA solar equations.
- Photos: Wikimedia Commons, author and licence under each image.
- Satellite view: Copernicus Sentinel-2 (ESA), scene S2C_10TCM_20251028_1_L2A.
- Orientation: OpenStreetMap land polygons (ODbL). Depth and terrain: GEBCO 2020 grid.
- Settlements: GeoNames places with 1,000+ inhabitants.
- Land cover: ESA WorldCover 2021, 10 m (CC BY 4.0).
Data compiled 2026-10-13. Something wrong? Report a data error.