United States / Wisconsin
Silver Lake Beach
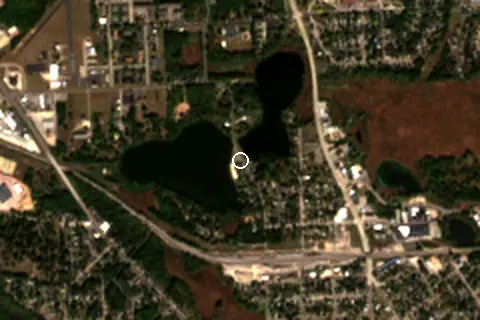
Silver Lake Beach is an inland beach, 1.6 km north-west of Portage (Wisconsin, United States). Average daytime highs peak at 28 °C in July and drop to -5 °C in January.
Weather month by month
November at Silver Lake Beach
Beach-day index 3.7/10 · United States median 3.3
| Measure | Jan | Feb | Mar | Apr | May | Jun | Jul | Aug | Sep | Oct | Nov | Dec |
|---|---|---|---|---|---|---|---|---|---|---|---|---|
| High °C | -5° | -3° | 5° | 13° | 19° | 25° | 28° | 26° | 23° | 14° | 6° | -2° |
| Low °C | -14° | -13° | -5° | 1° | 8° | 14° | 17° | 16° | 11° | 4° | -3° | -10° |
| Rain mm | 32 | 35 | 55 | 89 | 110 | 125 | 90 | 98 | 87 | 78 | 50 | 46 |
| Cloud % | 68 | 64 | 62 | 63 | 64 | 58 | 48 | 51 | 49 | 61 | 66 | 71 |
| Wind m/s | 5.4 | 5.5 | 5.3 | 5.5 | 4.8 | 4.2 | 3.8 | 3.7 | 4.3 | 4.9 | 4.9 | 5.0 |
| Daylight h | 9.3 | 10.5 | 11.8 | 13.4 | 14.7 | 15.4 | 15.1 | 14.0 | 12.6 | 11.1 | 9.7 | 9.0 |
| Record high/low | 9°/-41° | 17°/-33° | 26°/-29° | 28°/-13° | 33°/-3° | 34°/3° | 37°/8° | 36°/5° | 33°/0° | 29°/-6° | 22°/-16° | 17°/-31° |
| Beach index | 3.8 | 3.8 | 3.6 | 3.2 | 4.5 | 7.7 | 8.4 | 8.3 | 6.9 | 3.5 | 3.7 | 3.7 |
Long-term monthly averages: air from NASA POWER (2001–2020), sea from NOAA OISST (1991–2020); records are the extremes of 2001–2020. How the index works.
Setting
Within 1 km, the land is 42% tree cover, 35% built-up land and 21% grassland (satellite land-cover map, 2021): a partly built-up setting. Water makes up 9% of that circle.
- Tree 42%
- Built 35%
- Grass 21%
Land cover: ESA WorldCover 2021 (10 m).
This is not a sea beach, so no sea-temperature normals are shown.
When to go
The beach-day index peaks in July–August; July scores 8.4/10 with highs of 28 °C and 90 mm of rain.
In July that is 0.5 points above the median of the 2,466 beaches in United States covered by this atlas.
June is the wettest month (125 mm) and January the driest (32 mm); the yearly total is about 900 mm.
Daylight runs from 9.0 hours in December to 15.4 hours in June; in mid-July the sun rises at 05:29 and sets at 20:37 local time.
Facilities within 1 km
- 4Restaurants, cafés & bars
- –Public toilets
- –Showers
- 4Car parks
- –Lifeguard stations
- 1Hotels & guesthouses
- 3Grocery shops
Food and drink mapped within 1 km: 1 restaurant and 3 bars. Accommodation: 1 hotel or guesthouse.
Counted within 1 km of the beach (bus stops 1.5 km) from OpenStreetMap features and Overture Maps places, release of 2026-10. Unmapped does not mean absent.
Around the beach
Islands in view
- Westerberg Island 2.2 km S
Getting there
| Airport | Code | Distance | Direction |
|---|---|---|---|
| Dane County Regional Truax Field Madison | MSN | 47.1 km | south |
| Appleton International Airport Appleton | ATW | 110 km | north-east |
| Central Wisconsin Airport Mosinee | CWA | 137 km | north |
Straight-line distances from the beach; road distance is usually 20–40% longer.
Local transport: rail station Portage (690 m) and 4 mapped car parks within 1 km.
1 town or village of 1,000+ people lie within 10 km (about 10.4K residents); within 30 km there are 11 (about 44K).
Map and nearby beaches
Loading map…
Open in OpenStreetMap · Directions in Google Maps
| Beach | Distance | Warmest sea | Length | Surface |
|---|---|---|---|---|
| Silver Lake Beach | – | – | – | – |
| Warner Beach | 48.0 km S | – | 51 m | Sand |
| Marshall Beach | 50.9 km S | – | 44 m | Sand |
| Tenney Beach | 51.6 km S | – | 102 m | – |
| Spring Harbor Beach | 52.1 km S | – | 33 m | Sand |
| James Madison Beach | 52.8 km S | – | 55 m | Sand |
| Olbrich Beach | 52.9 km S | – | 74 m | Sand |
- Warner Beach48.0 km SCompare
- Marshall Beach50.9 km SCompare
- Tenney Beach51.6 km SCompare
- Spring Harbor Beach52.1 km SCompare
- James Madison Beach52.8 km SCompare
- Olbrich Beach52.9 km SCompare
- B B Clarke Beach53.4 km SCompare
- Terrace Beach53.7 km NECompare
Data on this page
- Air temperature, rain, cloud, wind, humidity: NASA POWER climatology 2001–2020, 0.5° grid.
- Beach outline, surface, rules and public facilities: OpenStreetMap contributors (ODbL), feature n354530907; restaurants, cafés, bars and lodging: Overture Maps places (CDLA-Permissive-2.0).
- Water body, status and length: Wikidata (CC0).
- Towns and time zone: GeoNames (CC BY 4.0). Airports: OurAirports (public domain). Sunrise and sunset: NOAA solar equations.
- Satellite view: Copernicus Sentinel-2 (ESA), scene S2B_15TYJ_20241009_0_L2A.
- Settlements: GeoNames places with 1,000+ inhabitants.
- Land cover: ESA WorldCover 2021, 10 m (CC BY 4.0).
Data compiled 2026-10-13. Something wrong? Report a data error.